Dodgers Performance Through Baseball Data
MLB TEAM PERFORMANCE ANALYTICS
This page is designed to help baseball fans research the Los Angeles Dodgers' 2026 performance using publicly available baseball data. By combining game results, run differential, and division standings, users can identify trends that are difficult to see from a team's overall record alone.
WHAT CAN YOU LEARN?
Winning and losing trends
Home vs. away performance
Offensive/defensive strength
Division position
WHAT KIND OF BASEBALL DATA IS AVAILABLE ONLINE?
Baseball websites provide several layers of performance data. Some sources provide raw game-by-game results, while others summarize that data into statistics or visualize how performance changes over time. Looking across multiple data sources allows fans to move from simply knowing what happened to understanding how and why a team's performance changed.
Game Level DataIndividual game results including opponents, scores, wins and losses, pitchers, and team records. |
Performance StatisticsStatistics such as runs scored, runs allowed, run differential, and home versus away performance. |
Season TrendsData showing how team performance and division position change throughout the season. |
|
From Data to Knowledge
Were the 2026 Dodgers consistently dominant, or does their strong overall record hide periods of poor performance?



Sample Analysis Walkthrough
Identify the Slump with ESPN
First, a fan can use ESPN's game-by-game schedule to identify a period of weaker performance. The Dodgers went from a 69-41 record to 69-47, revealing a six-game losing streak.
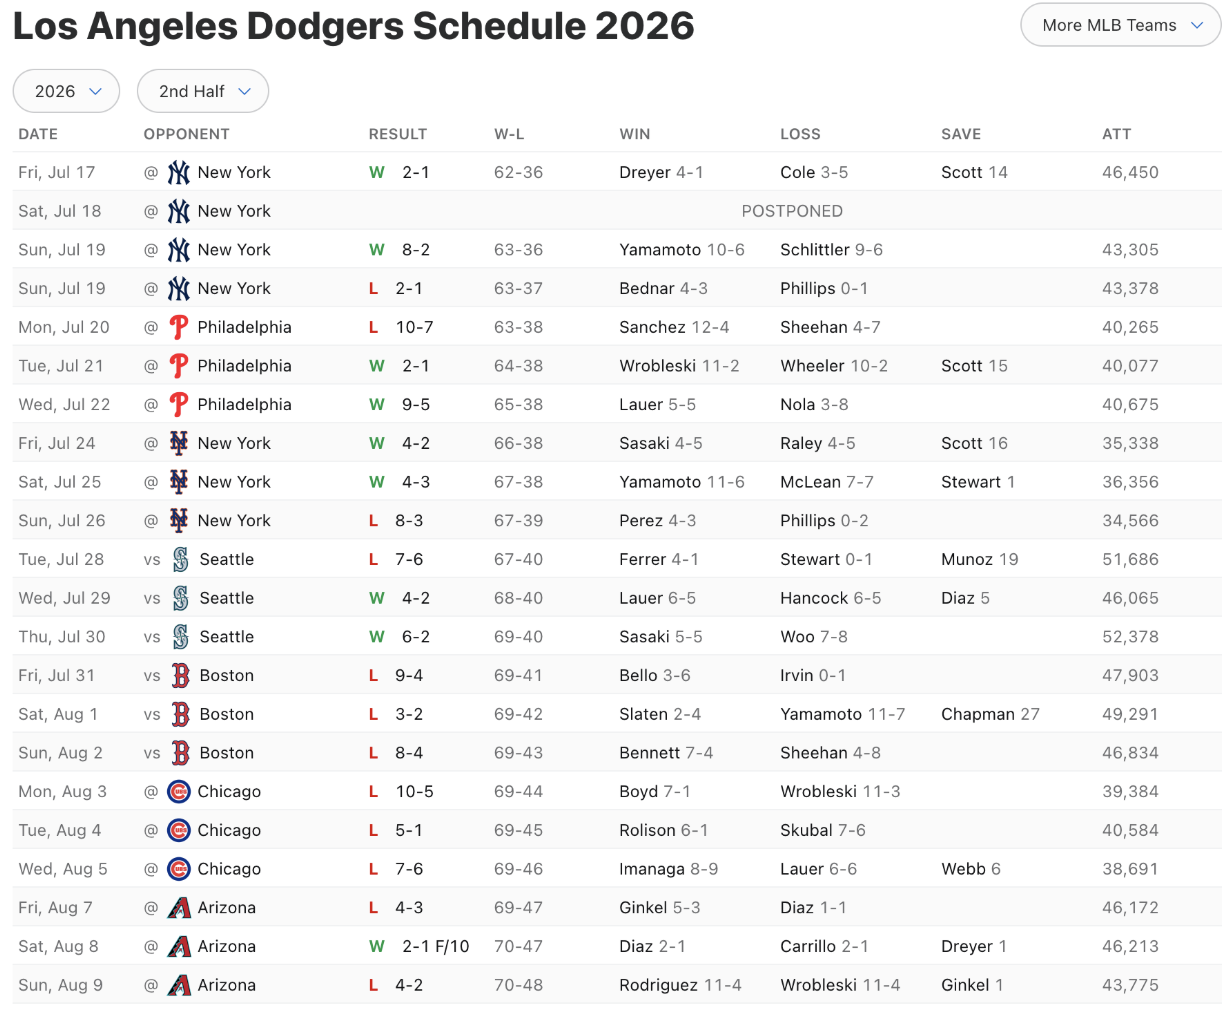
Figure 4: Dodgers six-game losing streak
Source:
ESPN
Compare the Slump to Overall Performance with TeamRankings
The fan can then use TeamRankings to determine whether this losing streak reflects the Dodgers' overall season performance. Despite the losing streak,the Dodgers still had a +153 run differential, meaning they had scored significantly more runs than they allowed overall.
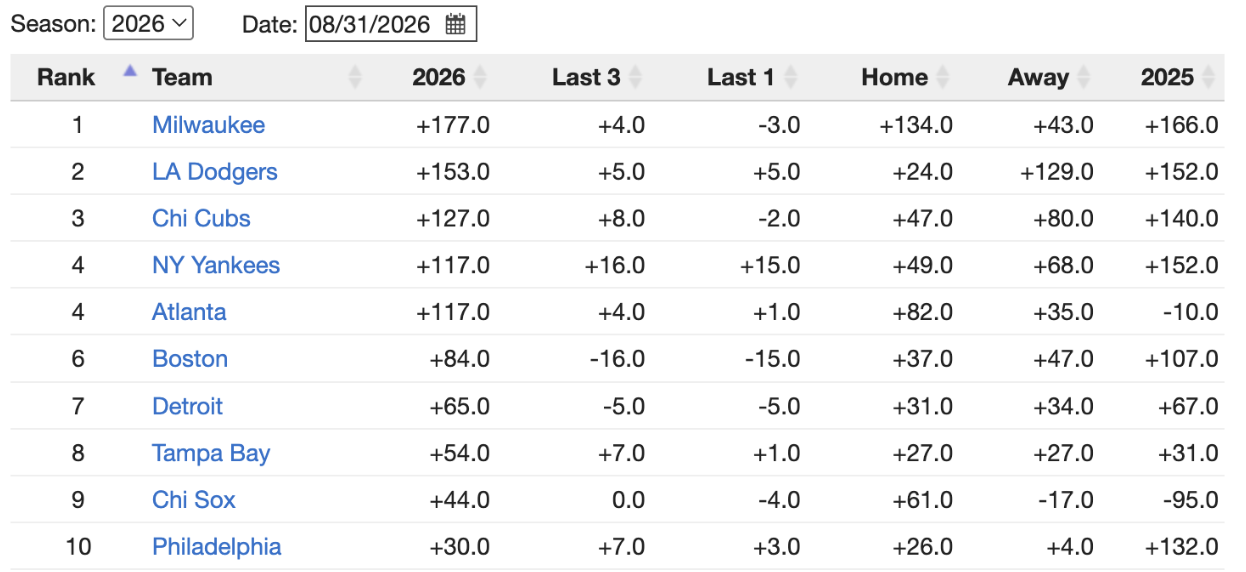
Figure 5: Dodgers run differential
Source:
TeamRankings
Examine the Division Impact with Greg Stoll
Finally, the fan can use Greg Stoll's division race graph to determine whether the losing streak significantly affected the Dodgers' position within the National League West. The graph shows that although the Dodgers declined, they remained well ahead of the other teams in their division.
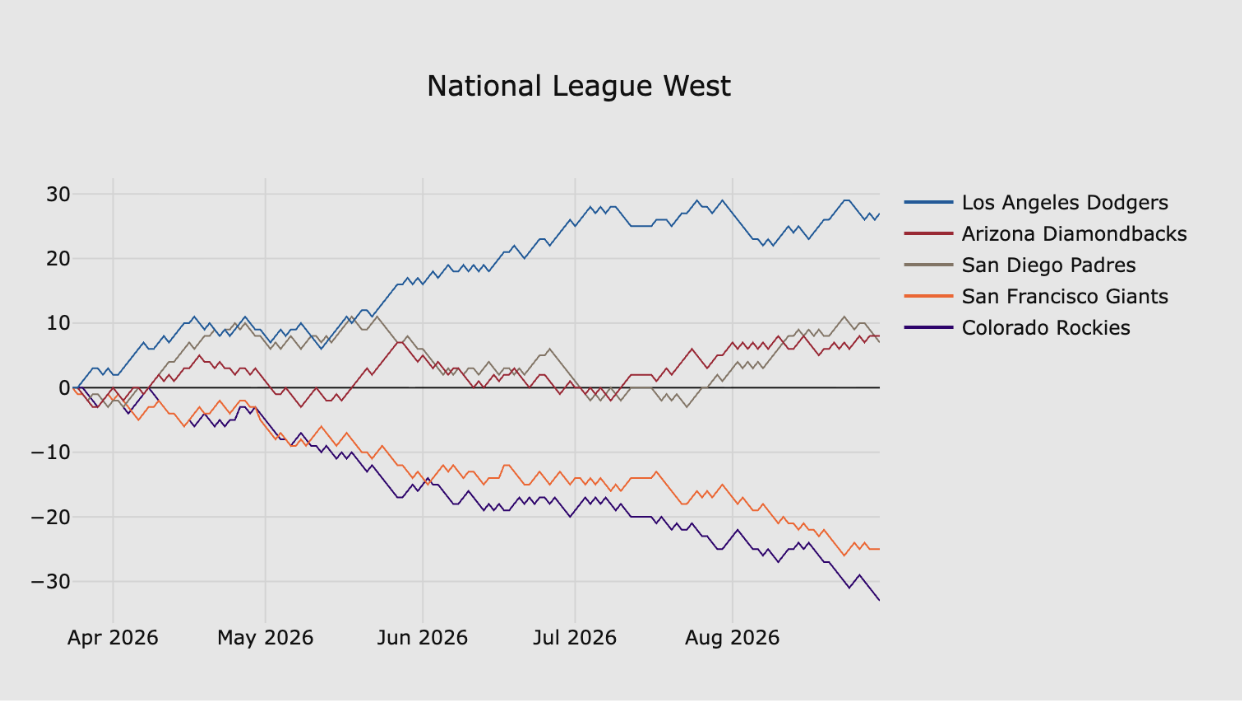
Figure 6: Dodgers position in the National League West
Source:
Greg Stoll
Final Insights
When used together, ESPN, TeamRankings, and Greg Stoll provide a more complete picture of the Dodgers' 2026 season. ESPN helps identify specific short-term trends, such as the six-game losing streak, while TeamRankings shows that the Dodgers still maintained a strong +153 run differential overall and reveals major differences between home and away performance. Greg Stoll then places those results in a larger competitive context by showing that the Dodgers remained well ahead of the other teams in the National League West despite their decline.
Together, these sources show that a strong overall season does not necessarily mean a team performed consistently at every point. By combining game-level results, performance statistics, and division trends, a fan can better understand not only what happened, but also how significant those changes were within the larger season.